datavisly.com/isobath
Bathymetry Studio
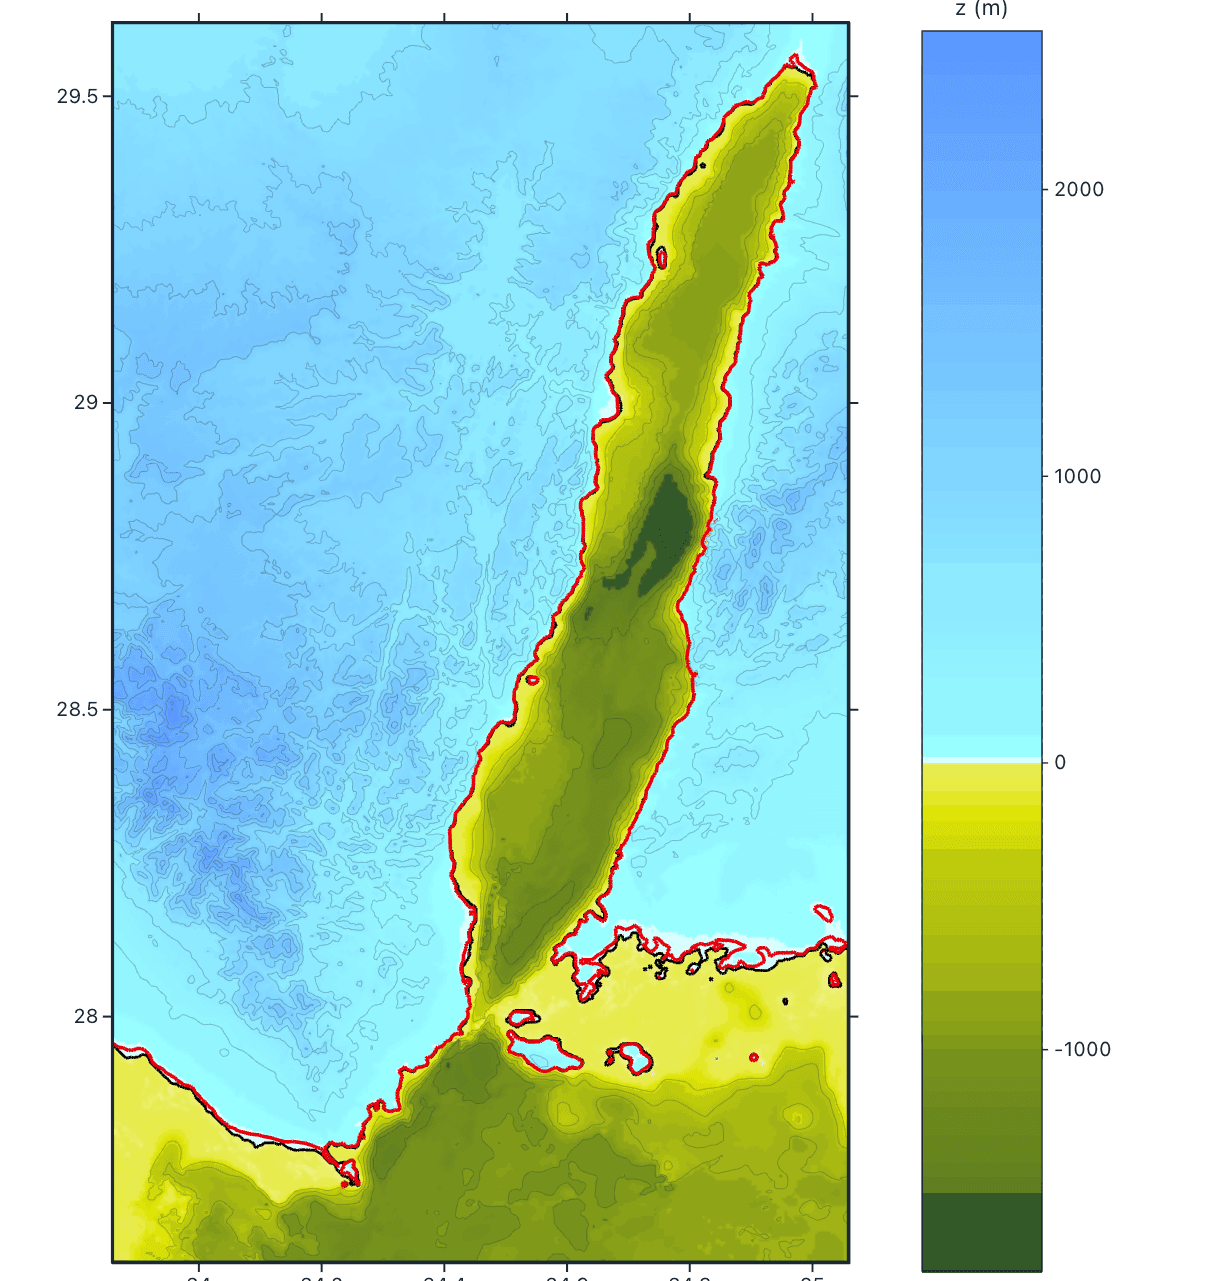
Isobath
A grid workbench for tsunami and coastal modelling workflows. Convert GEBCO Esri ASCII to Surfer 6 grids, run grid math, resample and contour — streaming multi-gigabyte files entirely in your browser.
- Convert GEBCO Esri ASCII (.asc) ↔ Surfer 6 (.grd)
- Streams multi-GB grids — no upload, no crash
- Grid math, mosaic resampling & contour views
- Digitize gauge points on the map & export
.asc.grd
Open Isobath